Leaves.PH

METRO MANILA · TREE-COVER MEASUREMENT SERIES

Tree canopy across the National Capital Region, measured from Sentinel-2 imagery.

17 LGUs, 8 annual epochs from 2019 to 2026. Inputs, thresholds, and aggregation are committed; outputs are hash-pinned and reproducible from a clean clone.

This report measures tree canopy in Metro Manila using Sentinel-2 surface-reflectance imagery, aggregated to the seventeen LGUs of the National Capital Region defined by PSA. Each 30-metre pixel is classified by a human-calibrated model, a gradient-boosted classifier over NDVI, Dynamic-World tree probability, Meta v2 one-metre canopy height, ESA land cover, and the raw Sentinel-2 spectral bands, trained on 656 manually labelled high-resolution pixels. Against those labels it scores F1 zero point seven eight and IoU zero point six four, well above the older NDVI greater-than-zero-point-six-two baseline (F1 zero point six eight), which is kept only as a comparison. It still over-calls some dense low vegetation, so the figure is a tree-canopy estimate with a known grass-and-scrub margin, not a pixel-exact census.

The area-weighted canopy across the NCR is roughly nine to ten per cent (the latest annual epoch reads eight point eight two per cent but is provisional). These are annual cross-sectional snapshots, not a change series. The calibrated model holds a steady band year to year; the old NDVI baseline swung about two point eight percentage points as greenness shifts pushed pixels across the fixed threshold, an imagery artefact the model removes.

Quezon City carries the largest absolute canopy share by area at about twenty-two per cent, anchored by the La Mesa watershed, UP Diliman, and the Wack Wack greens. The largest 2019-to-2026 snapshot differences sit in Caloocan, Valenzuela, and Marikina, but these are differences between cross-sectional snapshots, not measured canopy loss. Per-LGU values for every epoch in the series are in Fig 4 and the downloadable CSV. Open the map →

Inputs, the canopy model and its feature set, and aggregation logic are documented on the methodology page. The published CSV is hash-pinned; running make hash-verify against a clean checkout reproduces the canonical artefact byte-for-byte.
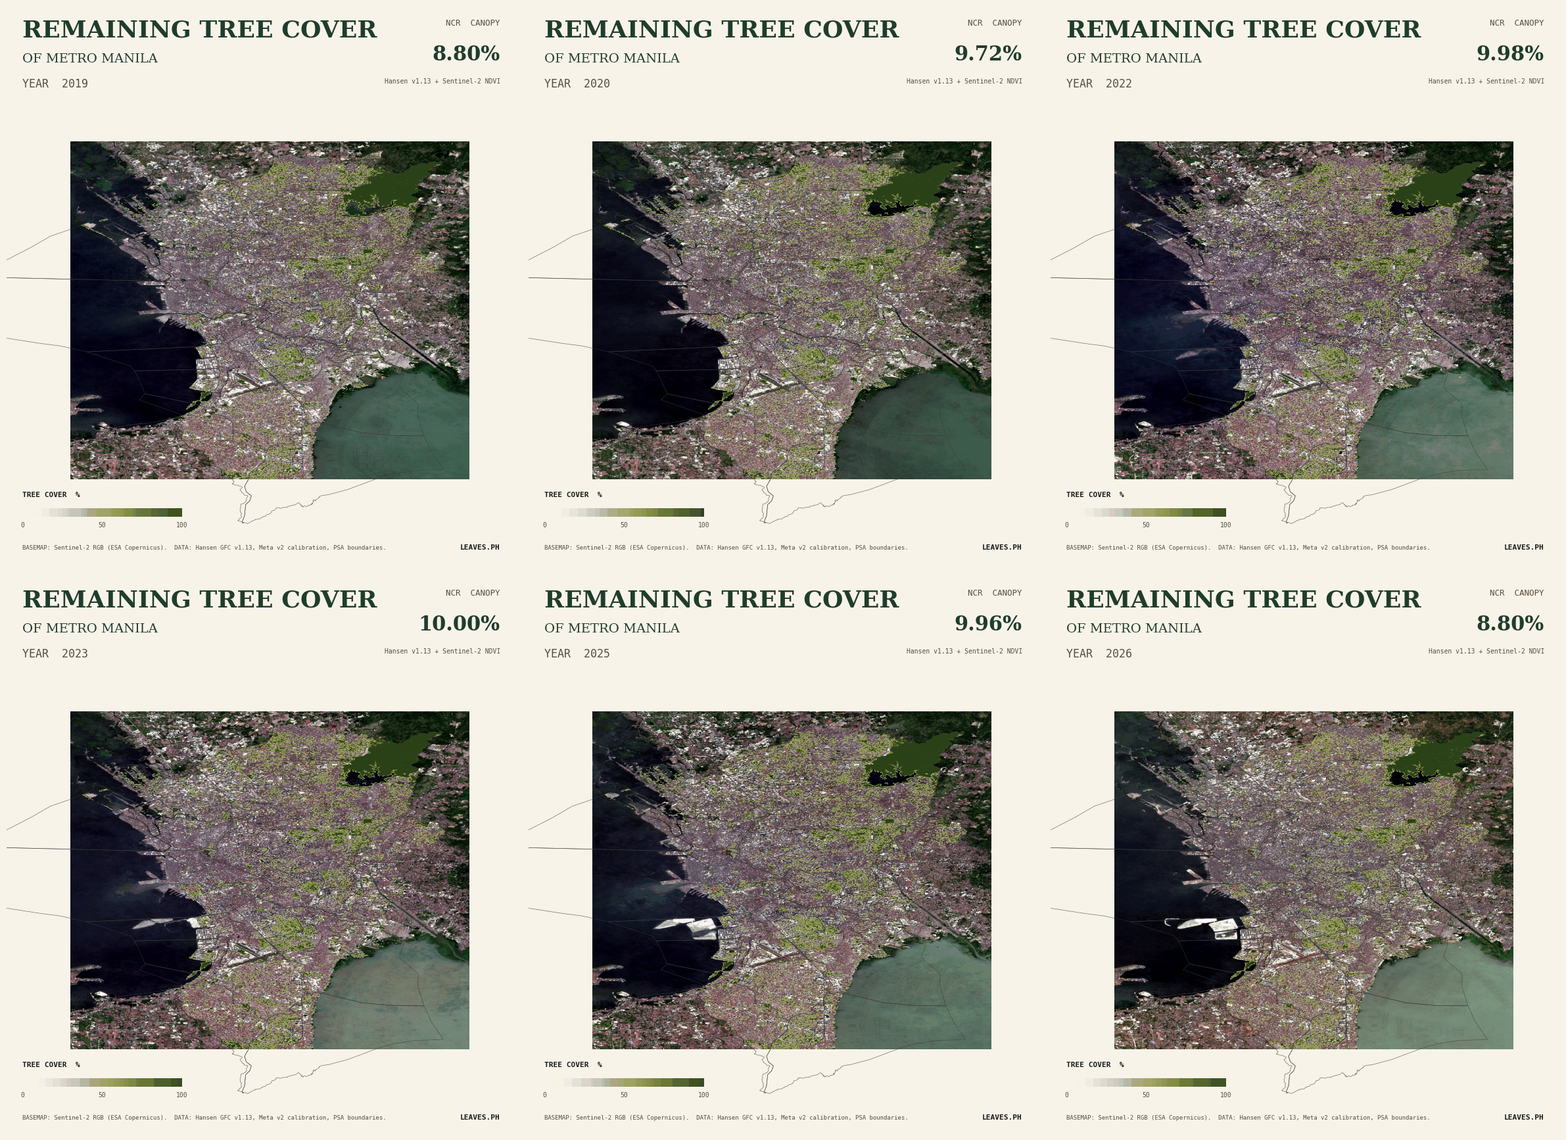
FIG · NCR CANOPY · 2019–2026

The NDVI baseline swings; the calibrated model holds steady.

Two readings of NCR canopy, same years. The old NDVI > 0.62 baseline (faint) swings about 2.8 pp year to year as cloud masks, sun angle, and seasonal phenology push pixels across the fixed threshold. The published human-calibrated canopy model (bold), trained on 656 manually labeled high-resolution pixels, holds a steady cross-sectional snapshot and scores F1 0.78 against those labels versus the baseline’s 0.68. The 2026 epoch is provisional (imagery January–May only) and shown dashed.

NCR tree canopy percent per year, 2019 to 2026 (human-calibrated canopy model) Two lines on a shared scale of NCR canopy percent. The old NDVI baseline swings between 7.46 and 10.24 percent across the series. The published human-calibrated model holds a steadier band near 10 to 11 percent, ending at 8.82 percent in 2026. The 2026 value of each series is provisional because that year's imagery covers January through May only. 6 7 8 9 10 11 NCR canopy % 2026 provisional 2019 2020 2021 2022 2023 2024 2025 2026 8.08 NDVI > 0.62 baseline · 2019: 8.08% 9.88 NDVI > 0.62 baseline · 2020: 9.88% 9.79 NDVI > 0.62 baseline · 2021: 9.79% 9.99 NDVI > 0.62 baseline · 2022: 9.99% 10.24 NDVI > 0.62 baseline · 2023: 10.24% 7.76 NDVI > 0.62 baseline · 2024: 7.76% 9.88 NDVI > 0.62 baseline · 2025: 9.88% 7.46 NDVI > 0.62 baseline · 2026 (provisional): 7.46% 8.81 Human-calibrated model (published) · 2019: 8.81% 9.74 Human-calibrated model (published) · 2020: 9.74% 10.11 Human-calibrated model (published) · 2021: 10.11% 10.00 Human-calibrated model (published) · 2022: 10.00% 10.02 Human-calibrated model (published) · 2023: 10.02% 9.15 Human-calibrated model (published) · 2024: 9.15% 9.99 Human-calibrated model (published) · 2025: 9.99% 8.82 Human-calibrated model (published) · 2026 (provisional): 8.82%
human-calibrated model · published NDVI > 0.62 baseline · comparison dashed = 2026 provisional 2019→2026 shift, published: +0.01 pp
Sentinel-2 RGB satellite basemap of Metro Manila with remaining tree-cover density overlay, animated 2019 to 2026. The basemap cycles each epoch; the green density layer shows where canopy persists.
2019 → 2026 · Sentinel-2 RGB basemap · canopy density overlay · 8 frames 30 m pixel · on-frame value = mean canopy density (Hansen-adjusted), not the area-weighted headline

FIG 3 · METHODOLOGY CROSS-REFERENCE

Adjacent published estimates of Metro Manila tree cover.

Definitions differ across sources: canopy fraction versus closed-canopy area, percentage versus hectares, single-epoch versus multi-year baselines. The table lists figures as published; it is a methodology reference, not a ranking.

Source Figure Definition
DENR FMB 6·00% Canopy fraction (cited)
Global Forest Watch 4·00% Hansen GFC tree-cover, 30% canopy threshold
Earth Journalism Network 2,071 ha Open-forest area (hectares)
Meta canopy v2 7·50% 1 m canopy height > 5 m
Leaves.PH 8·82% Sentinel-2 NDVI > 0·62, Meta-calibrated

For methodology, threshold derivation, and calibration details, see /methodology.


FINDING

Quezon City carries the largest single share of NCR canopy; without it, the regional average is closer to four per cent.

FIG 4 · NCR LGUs · LATEST EPOCH

Quezon City alone carries the regional average.

LGU 2026 2019 → 26
01Quezon City22·10%−0·22pp
02Caloocan14·36%−1·42pp
03Makati12·22%+1·77pp
04Mandaluyong10·36%+0·73pp
05Marikina7·96%−0·32pp
06Pateros7·40%+1·73pp
07Las Pinas7·12%−0·20pp
08Pasig6·63%+0·53pp
09Paranaque6·26%+0·93pp
10Muntinlupa5·06%−0·15pp
11Taguig4·80%+0·60pp
12Valenzuela4·46%−0·68pp
13San Juan4·45%+0·24pp
14Pasay2·97%−0·07pp
15Malabon2·53%−0·20pp
16Manila1·37%+0·23pp
17Navotas0·30%−0·24pp