SECTION 1 · METHOD
How Leaves.PH measures Metro Manila tree cover.
Current scope: 17 NCR LGUs at canonical PSA boundaries, plus 892 OSM admin-level=10 barangay polygons for the finer view.
Plain-English version
Pick a year. For every patch of the National Capital Region, look at the Sentinel-2 satellite image of that patch for that year. If the patch looks green enough on a standard vegetation index (NDVI), call it canopy. Add up the canopy patches inside each LGU. Divide by the LGU's total area. That is the canopy fraction for that LGU that year.
The single number "green enough" is tuned by checking against Meta's separate 1-meter canopy-height product: at what NDVI threshold do most of our "canopy" pixels also have a Meta height greater than 5 meters? The answer for NCR is NDVI greater than 0.62.
On top of that pixel rule, we train a second pass that looks at 240m tiles of imagery instead of single pixels. It learns from OSM-tagged trees, ESA-tagged tree cover, and Meta's canopy-height map all together. The second pass agrees with the per-pixel rule at the regional level and corrects local cases where a single NDVI threshold over- or under-counts (sparse urban trees, mixed-class neighborhoods).
Everything below is the same story, with the parameters and citations.
Inputs
Five canonical canopy / land-cover datasets, all pulled via Google Earth Engine or AWS Open Data, all bit-exact reproducible from the committed manifests:
- Sentinel-2 L2A via
COPERNICUS/S2_SR_HARMONIZED. Annual median composites 2019 to 2026, cloud-masked at s2cloudless probability < 40, exported at 30 m to match Hansen's grid. - Hansen Global Forest Change v1.13 via
UMD/hansen/global_forest_change_2025_v1_13. Year-2000 canopy baseline, 2001-2025 annual loss (lossyear), 2000-2012 binary gain. 30 m native. - ESA WorldCover v200 via
ESA/WorldCover/v200. 2021 single-epoch, 10 m class-10 = trees. Independent cross-check. - Dynamic World v1 via
GOOGLE/DYNAMICWORLD/V1. Annual mediantreesprobability 2019 to 2026, downsampled to 30 m for the shared GEE 50 MB sync-URL limit. - Meta Canopy Height v2 from
s3://dataforgood-fb-data/forests/v1/alsgedi_global_v6_float/chm/. 1 m height truth (source imagery 2018-2020), Bing-style quadkey tiles, downloaded for the 4 zoom-9 tiles overlapping NCR, mosaicked, reprojected EPSG:3857 to EPSG:4326.
NDVI threshold
For each year, we compute NDVI = (NIR - RED) / (NIR + RED) per pixel from the Sentinel-2 composite. A binary canopy mask is derived by thresholding NDVI ≥ T, where T is calibrated against Meta canopy height v2.
Calibration is F1-maximising over a 0.40 to 0.70 sweep, with a recall floor of 0.85 against Meta height > 5 m. The sweep table lives at data/calibration_report.json. The result is documented in BENCHMARKS.md.
Honesty caveat: Meta v2's source imagery is 80 percent from 2018-2020, so the calibration layer is closer to a 2019 truth than a current-epoch truth. We treat NDVI-vs-Meta agreement as a constant offset and apply the same threshold to every epoch. A future revision can introduce a per-epoch calibration once GEDI L2A monthly RH98 spot-truth is integrated.
Per-LGU aggregation
LGU polygons come from OpenStreetMap admin-level=6 relations for the 17 NCR LGUs (16 cities + Pateros). Each year's canopy mask is masked by each LGU polygon; canopy hectares are computed by multiplying pixel count by the latitude-corrected pixel area (cos(14.6 deg)) and dividing by 100 (km^2 -> ha). The result is the per-LGU CSV data/per_lgu/per_lgu_canopy_2019_2026.csv, the hash-verified canonical artifact.
Adjacent published estimates
Other publicly available estimates of Metro Manila tree cover use different definitions, sensors, and vintages. They are listed here for methodology context, not as a ranking:
- DENR FMB (cited in news and EJN, 2024+): 6 percent canopy fraction. Source document not in public 2024+ reports we have located at the time of this release.
- Global Forest Watch dashboard PHL/47: 4.0 percent, derived from Hansen GFC at the 30 percent canopy-cover threshold, 2020 baseline.
- Earth Journalism Network 2024 (DENR-sourced "open forest"): 2,071 hectares for 2020. Reports an area, not a fraction; different class definition.
- ScienceKonek 2024 map: referenced by RadarPH; raster and methodology not publicly findable at the time of this release.
- Meta canopy v2 (canopy height > 5 m): 7.5 percent. Used here as the calibration reference for the NDVI threshold.
Leaves.PH publishes a reproducible measurement series with the full pipeline committed. The intent is to add a separately-defined, fully reproducible measurement to the public record; not to rank against any of the above.
Detection model (in optimization)
Alongside the NDVI baseline, a detection model estimates continuous canopy density per tile. It follows the SolarMap.PH playbook: per-tile CLIP ViT-Large/14 embeddings regressed onto Meta v2's >5 m canopy fraction (0..1) with gradient boosting, deterministic hyper-parameters, Meta canopy height as the reference signal.
On held-out locations the model never saw in training (5-fold cross-validation grouped by location, 16,800 tiles across 2019-2026), it reaches R² 0.83–0.86 under grouped cross-validation (0.86 location-grouped, 0.83 spatial-block; MAE 0.053) against Meta's 1 m reference. That figure measures how well the model reproduces Meta's canopy fraction, its calibration target, not accuracy against independent ground truth; against ESA WorldCover v200 the underlying NDVI mask agrees on 93% of pixels (IoU 0.52). This CLIP detection model is a separate research track; the published per-LGU and per-barangay canopy figures on this site come from the human-calibrated canopy model described next.
Published canopy model (human-calibrated)
The published canopy product is a gradient-boosted classifier over ten per-pixel features available every year: NDVI, Dynamic-World tree probability, Meta v2 one-metre canopy height, the ESA WorldCover tree class, and the raw Sentinel-2 spectral bands (red, NIR, green, blue, GNDVI). It was trained on 656 30-metre pixels labelled by hand against 0.5–1 m Esri World Imagery: an active-learning pass concentrating on the NDVI decision boundary and grass-vs-tree confusion zones, plus a 500-pixel uniform-random round to tighten the confidence intervals.
Scored against those manual labels under region-grouped out-of-fold cross-validation with post-stratified population weighting, the model reaches F1 0.78, IoU 0.64 (precision 0.77, recall 0.79). The old NDVI > 0.62 rule scores F1 0.68, IoU 0.52 on the same labels (precision 95% CI 0.61–0.76 at n=656); the model recovers diluted urban-fringe canopy the threshold missed and uses the green/blue bands to reject high-NDVI grass and scrub the threshold over-called (precision 0.67→0.77). It also removes the year-to-year sawtooth of the NDVI series (a fixed-threshold artefact), holding a steady 9–10% cross-sectional snapshot. The spectral bands lifted F1 from 0.75 (four-feature model) to 0.78; a CLIP ViT-L/14 embedding was tested and did not help, so it was dropped. The NDVI baseline is retained only for comparison. Full numbers in BENCHMARKS.md.
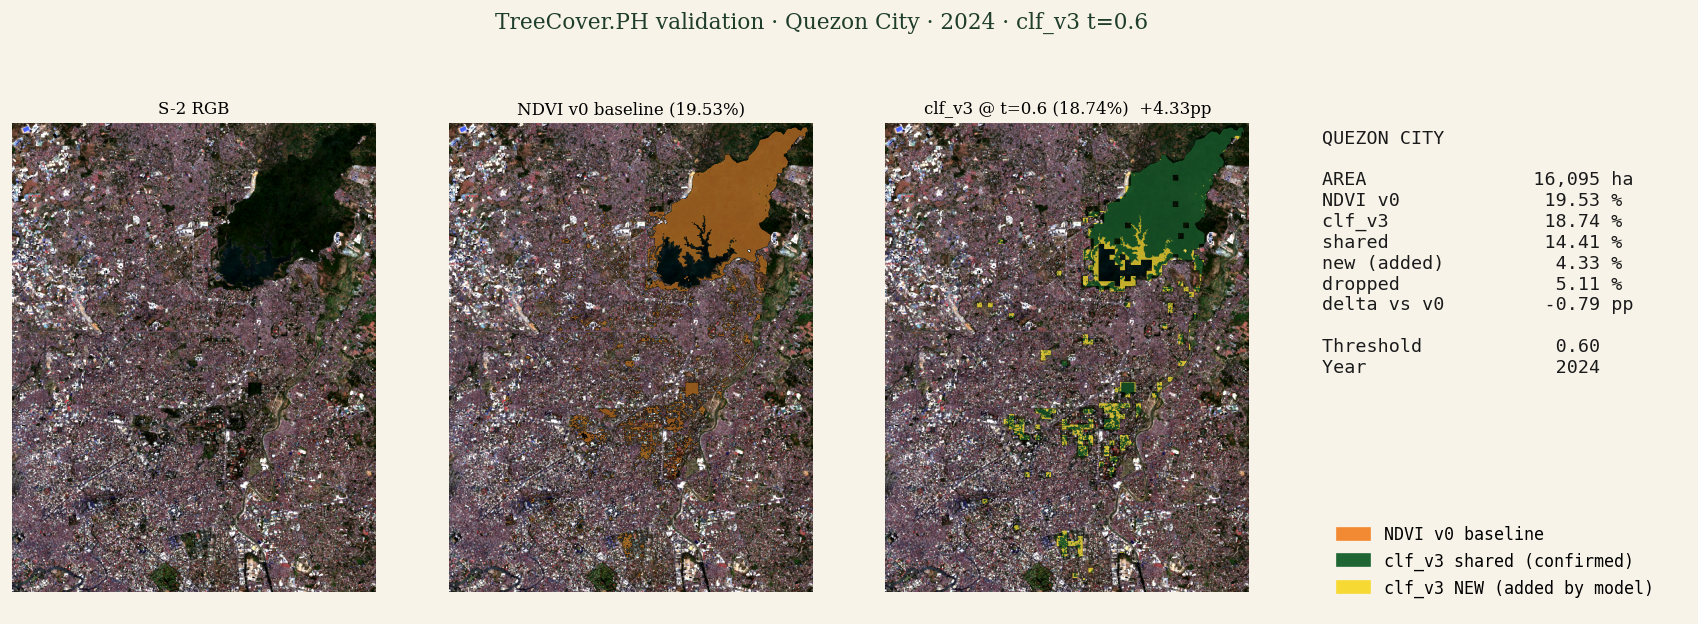
Per-LGU validation panels, one PNG per LGU, are browsable at /validation and stored at site/public/validation/. Each panel shows S-2 RGB, NDVI v0 baseline (orange), clf shared/confirmed (green), and clf NEW additions (yellow). Full benchmark table in BENCHMARKS.md.
Known limitations
- 30 m output resolution (matched to Hansen; trades off some urban-tree detail).
- Calibration epoch is ~2019 (Meta source imagery); the same threshold is applied to every epoch in the 2019–2026 series.
- Hansen 30 m misses small-scale urban tree-cutting events; localised clearings appear in the global Hansen product only at the next release cadence.
- Dynamic World probability values reflect model confidence, not ground truth.
- Per-LGU and per-barangay (892 OSM admin-level=10 polygons) ship in this release; 10 m chunked exports for finer urban-tree detail are the next granularity push.
Reproduce locally
git clone https://github.com/xmpuspus/leaves-ph
cd leaves-ph
python3 -m venv .venv && source .venv/bin/activate
pip install -r requirements.txt
earthengine authenticate   # one-time interactive
make fetch                 # ~30 min GEE + AWS
make calibrate             # tunes the NDVI threshold against Meta
make compute               # per-year canopy mask + per-LGU CSV
make verify                # release gate
Full prior-work review and dataset attribution: docs/research/prior-work.md. License: code MIT, data CC-BY-4.0.